 Mar 21, 2024
Persona
At the office, the days between Christmas to New Years are quiet. Maybe too quiet. So I have a ritual. During this week between holidays, I update, analyze, and prepare new demographic data for the coming year, pulling from government, education, private, and internal sources.
Demographic information at the ZIP Code and market level is pretty cool. I say that not just as a researcher who loves data but because I believe they can play a pivotal role in making strategic decisions across a wealth of topics.
The Importance of Location-Based Demographic Data
Most people have a pretty good understanding of the community they live or work in. We see our neighbors, interact with the issues and challenges of our community, and have our own experiences to reference. But our own experiences only take us so far. That’s where good data comes in.
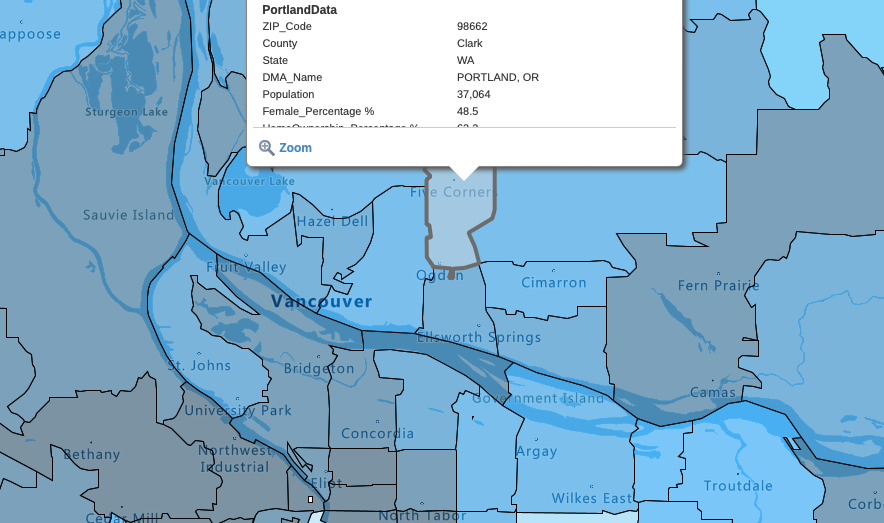
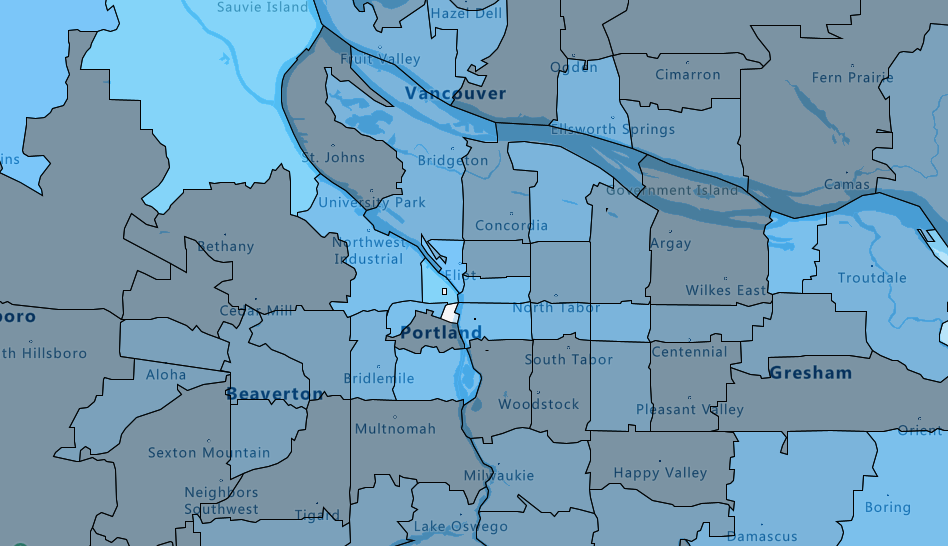
I live in Vancouver, Washington, a suburb of Portland in a suburban cul-de-sac neighborhood with many young professionals and families. My first assumption was that the educational attainment in my ZIP Code was likely very high. Turns out, it’s on the low-end—especially compared to other ZIP Codes in the area, both on our side of the river and in Portland proper.
Data tells us things we can’t always see—both in communities close to us and those far away. For colleges recruiting students, this kind of demographic data is an invaluable resource. Take my neighborhood for example, the educational attainment of parents is one of the best predictors of students going on to college themselves. Having this type of information at a targetable geographic level like a ZIP Code is critical.

With thinning numbers of students and the upcoming demographic cliff, expanding into new markets is vital for enrollment growth. But, expanding into markets you’re not familiar with can be a challenge of knowing where to start. You could use a shotgun approach to introduce a new market into your enrollment ecosystem, folding in every county and zip code. However, I believe smart strategies targeting individual areas, or small clusters of ZIP codes, can create a more effective and lasting foothold.
Carnegie combined some of the demographics most likely to predict whether a household will send students to higher education (income, parental education, high school graduation rates, distance to higher education options, and more) to create a Higher Education Index. The higher the Higher Education Index, the more likely students from that zip code are to enroll, making them stronger options in which to start a campaign. Having this kind of data, both in a visual format and in useful spreadsheets, leads to better precision in decision making so that fewer resources are needed to optimize potential in new markets.

Making Sense of the Data
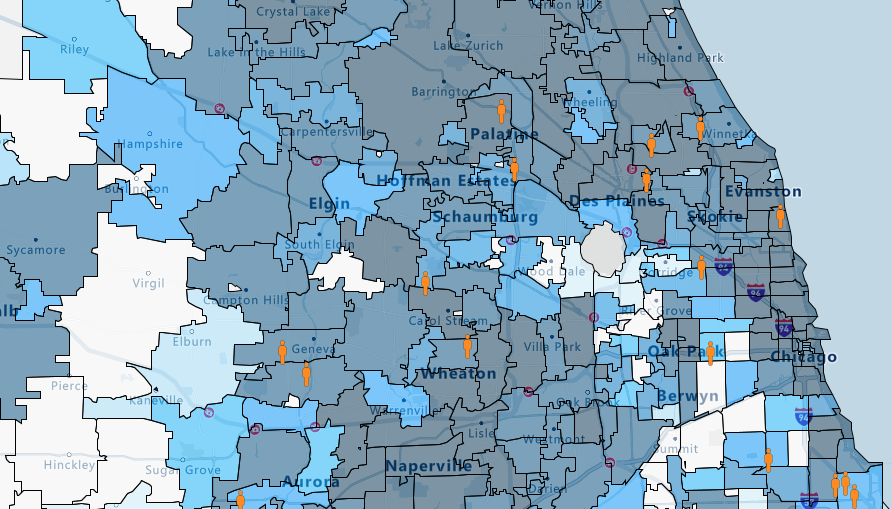
Importantly, mapping this type of information is only one step in market expansion and optimization. In addition to demographics and layers of knowledge from secondary sources, your own enrollment history and internal information can be pivotal. Inquiry and deposit success can be tracked over time and compared to the strategies used in that area or demographics that are shifting. Alumni data is another great source of additional information. For example, opportunity in Chicago for one institution was seeing a tremendous amount of competition, but tracking both alumni density and past deposits helped to find a foothold in the country’s third-largest market. This was connected to other factors of opportunity and demographics to select a small cluster of ZIP codes for purchasing student names and creating a digital ad campaign.

Of course, there are potential pitfalls in using demographic data without careful consideration of the whole picture. For example, simply looking at population growth as a metric, while interesting, might also steer a college looking for undergraduates to retirement communities in Florida. Rather, if growth can be paired with things like age bands, income considerations, and historic inquiry volume, a clearer picture starts to emerge.
Using the Data
At Carnegie, we tackle the question of “where” for a range of applications, such as student search, digital marketing, travel programs, campus or site extension opportunities, and anything else that might be tied to geographies and markets. Through our Market Opportunity Index, we look at 8 distinct factors for determining whether a market (we use Nielsen DMAS) or a ZIP Code will offer an opportunity for enrollment expansion. We then layer demographic data on top based on strategic needs. For example, by looking at technology access demographics and employment mobility needs, we can identify which ZIP codes in a given market with adult student audiences might offer the best online education opportunities. This can then inform the digital marketing there or the time spent actively reaching out to prospects in a given ZIP code cluster.
If you’re curious about Carnegie’s use of demographic and geographic information, please reach out to learn more.
